
Are There More Hurricanes Than in 1980?
Descrição
Every tropical cyclone on Earth since 1980 — 4,983 storms, drawn from 46 years of satellite and reconnaissance data. Are hurricanes actually getting more common?
Next: https://www.youtube.com/watch?v=Cg980Sz5p-Y
More maps like this: https://www.youtube.com/playlist?list=PLT8tphqp1lNM
Paths are real tracks (NOAA IBTrACS). Color = how strong the storm is at that moment. Ring = a storm just reached Category 3 or higher.
CHAPTERS
0:00 Intro
0:18 The 1980s
0:49 Hurricane Allen (1980)
3:42 Hurricane Gilbert (1988)
4:21 The 1990s
5:17 Hurricane Andrew (1992)
6:09 Hurricane John (1994)
7:16 1997: a record year
8:30 The 2000s
9:52 Hurricane Catarina (2004)
10:26 Hurricane Katrina (2005)
10:36 Hurricane Wilma (2005)
12:04 The 2010s
13:15 Typhoon Haiyan (2013)
14:02 Hurricane Patricia (2015)
14:13 Cyclone Winston (2016)
15:08 Typhoon Mangkhut (2018)
15:47 The 2020s
16:12 Typhoon Surigae (2021)
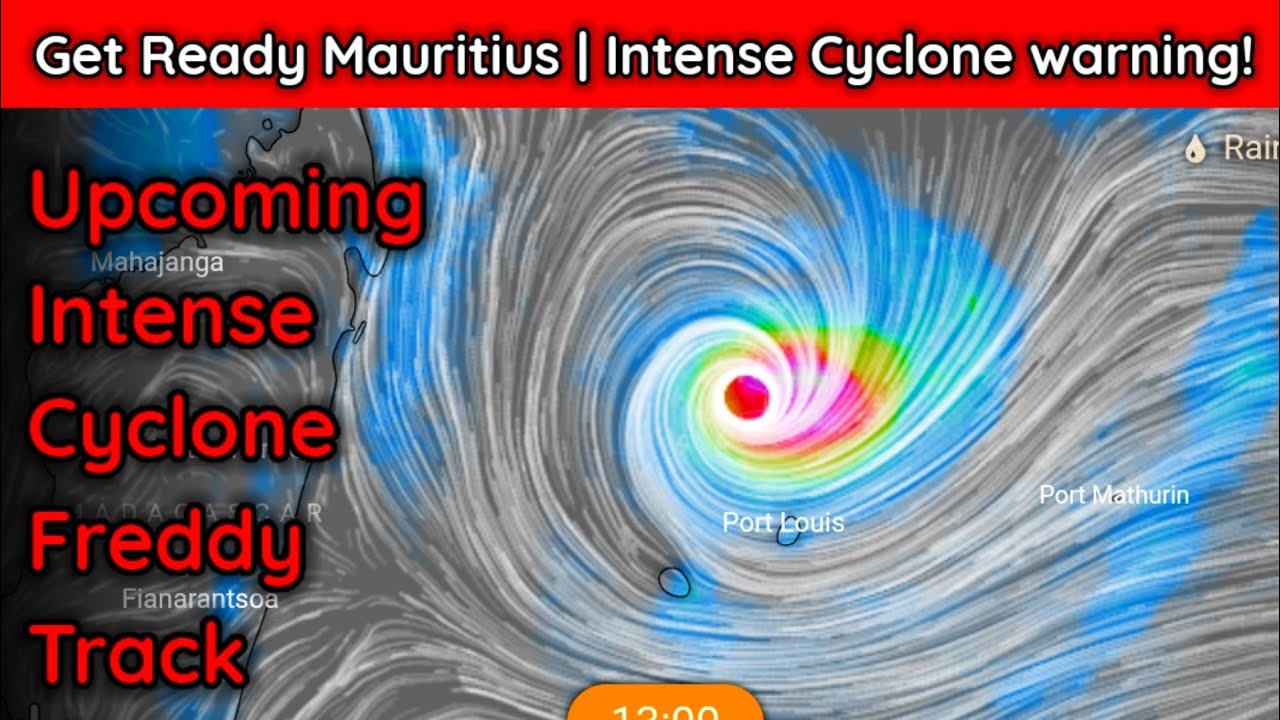
16:54 Cyclone Freddy (2023)
17:55 Hurricane Melissa (2025)
18:18 Conclusion
Also featured, just before the 2000s: the 1999 Odisha cyclone (unnamed), North Indian Ocean.
HOW TO READ THE NUMBERS
Each storm is counted once, in the strongest category it has reached so far. When it moves up a category, the old count drops by one, the new one rises by one, and both flash gold. The five numbers always add up to the total so far. Storms are counted by the year they formed.
DEFINITIONS
Winds and pressures: US best track (NHC/JTWC), 1-minute sustained winds. IBTrACS reports winds in knots (kt) and pressure in hPa; the video shows miles per hour (1 kt = 1.15078 mph) with km/h in parentheses (1 kt = 1.852 km/h), rounded, and millibars (mb) with hPa in parentheses (1 mb = 1 hPa). Some agencies use a 10-minute average, which reads lower for the same storm (Typhoon Haiyan: 196 mph (315 km/h) on the US scale, about 144 mph (232 km/h) on Japan's).
The date in the top right is UTC. Dates on the storm cards follow the local date given by the source agency, so they can differ by a day.
The record runs from January 1, 1980 to September 20, 2026 (IBTrACS, retrieved September 22, 2026). Storms after that date — including Hurricane Polo — are not included, because best-track data is finalized later.
* 1999 Odisha cyclone: the US best track has no central pressure for this storm, so the 912 mb (912 hPa) on screen is the value reported to the WMO by the India Meteorological Department.
WHY STORMS SPEED UP AND CURVE
Near the equator, storms drift west with the trade winds; farther out, the westerlies catch them and they turn and speed up. In this dataset the median speed is about 9 mph (15 km/h) near the equator and about 24 mph (38 km/h) at 40–50° latitude. Background: https://www.nesdis.noaa.gov/about/k-12-education/atmosphere/what-are-trade-winds
THE CONCLUSION, IN SHORT
The number of tropical cyclones per year hasn't gone up over 1980–2024. The share reaching major strength (Category 3+) has: from about 4 in 10 hurricane-strength storms in the 1980s to about half since the 1990s. Part of the early jump reflects changes in how satellites measured storms; a study that corrected for this (Kossin et al., 2020) still found a rise in the share of major-strength readings, which the IPCC (AR6) rates "likely."
DEATHS AND DAMAGE
Shown only where confirmed against an official primary source: Katrina (1,833 deaths; US$108 billion, 2005 dollars — NHC report), Andrew (US$26.5 billion, 1992 dollars — NOAA Tech. Memo NWS NHC-6), Haiyan (about 6,300 deaths — NDRRMC). Allen's death toll is shown as a range (269–281) because sources disagree. Details in the pinned comment.
DATA AND SOURCES
Tracks, winds, pressure, categories: NOAA IBTrACS v04r01 (public domain) — https://www.ncei.noaa.gov/products/international-best-track-archive
Basemap: Natural Earth (public domain) — https://www.naturalearthdata.com
Andrew re-analysis: NOAA/AOML — https://www.aoml.noaa.gov/hrd/hurdat/HurricaneAndrewReanalysis.html
Freddy/John duration records: WMO — https://wmo.int/news/media-centre/tropical-cyclone-freddy-longest-tropical-cyclone-record-36-days-wmo
Photo credits (public-domain satellite images): see the pinned comment.
MUSIC
"Permafrost," "Hymn to the Dawn," and "Meanwhile" by Scott Buckley — scottbuckley.com.au — licensed under CC BY 4.0 (https://creativecommons.org/licenses/by/4.0/)
Trimmed and crossfaded for this video.
Pathlines — the paths things take, drawn on a map, over time.
#hurricanes #maps #dataviz #timelapse #tropicalcyclones
Palavra-chave: ciclone fredy

























Comentários da comunidade
@Pathlines YouTube · 27/09/2026
A few notes that didn't fit in the video: DATA & DEFINITIONS • Tracks, wind speed, pressure, category: NOAA IBTrACS v04r01 (public domain), US best track (NHC/JTWC), 1-minute sustained winds. The data give winds in knots and pressure in hPa; the video shows mph (1 kt = 1.15078 mph) and km/h (1 kt = 1.852 km/h), and mb with hPa in parentheses (1 mb = 1 hPa). • Storms are counted once, by the year they formed, in the strongest category they ever reached. • The date in the top right is UTC; card dates are the local dates given by the source agency. • The record ends September 20, 2026 (IBTrACS, retrieved September 22, 2026). Later storms, including Hurricane Polo, are not in this data yet. • Basemap: Natural Earth (public domain). Country borders are shown for geographic reference only. SATELLITE PHOTO CREDITS (all public domain) 1. Hurricane Allen (1980) — NOAA. Satellite data from NOAA CLASS; Blue Marble background from NASA EOSDIS Worldview. 2. Hurricane Gilbert (1988) — NOAA. Satellite data from NOAA CLASS; Blue Marble background from NASA EOSDIS Worldview. 3. Hurricane Andrew (1992) — NOAA. class.noaa.gov, Inventory ID 1998489, Dataset NSS.HRPT.ND.D92236.S1231.E1. 4. Hurricane Katrina (2005) — NASA. visibleearth.nasa.gov/view_rec.php?id=7938 5. Hurricane Wilma (2005) — NASA. earthobservatory.nasa.gov/NaturalHazards/view.php?id=15703 6. Hurricane Melissa (2025) — NASA. NASA EOSDIS Worldview (worldview.earthdata.nasa.gov). 7. Typhoon Haiyan (2013) — NASA. NASA EOSDIS Worldview (worldview.earthdata.nasa.gov). 8. Typhoon Mangkhut (2018) — NASA. earthobservatory.nasa.gov/images/92741/typhoon-mangkhut 9. Typhoon Surigae (2021) — NASA. NASA EOSDIS Worldview (worldview.earthdata.nasa.gov). 10. Hurricane John (1994) — NOAA. NOAA CLASS archive (class.noaa.gov). 11. Hurricane Patricia (2015) — NASA. NASA Rapid Response / LANCE. 12. Cyclone Winston (2016) — NASA. NASA EOSDIS Worldview (worldview.earthdata.nasa.gov). 13. Cyclone Freddy (2023) — NASA. NASA EOSDIS Worldview (worldview.earthdata.nasa.gov). 14. 1999 Odisha cyclone (unnamed) — US Joint Typhoon Warning Center, Tropical Cyclone 05B report. 15. Hurricane Catarina (2004) — NASA. visibleearth.nasa.gov/view_rec.php?id=6288 16. 1997 record-year card — NASA/JPL TOPEX/Poseidon sea-level image of the 1997 El Niño (public domain), via Wikimedia Commons: commons.wikimedia.org/wiki/File:1997_El_Nino_TOPEX.jpg DEATHS & DAMAGE — WHY SOME STORMS SHOW NUMBERS AND OTHERS DON'T We only show a death or damage figure when we could confirm it against an official primary source: • Katrina: 1,833 deaths, about US$108 billion (2005 dollars) — NHC Tropical Cyclone Report (AL122005). • Andrew: damage, US$26.5 billion (1992 dollars) — NOAA Technical Memorandum NWS NHC-6. • Haiyan: about 6,300 deaths — official NDRRMC (Philippines) figure via NOAA Climate.gov. • Allen: deaths shown as a range (269–281) because sources disagree; damage is NOT shown because the 1980 NHC preliminary report only gives a country-by-country breakdown (Haiti $400M+, Texas $600M, ...), not one confirmed total, and adding those up ourselves would not be a source-stated figure. Mangkhut and the 1999 Odisha cyclone have official-agency estimates that vary too widely to show a single number responsibly. The rest (Winston, Catarina, and others not listed above) simply don't have an official total we could confirm before this video's release — not that the storm was minor. MUSIC "Permafrost," "Hymn to the Dawn," and "Meanwhile" by Scott Buckley (scottbuckley.com.au), licensed under CC BY 4.0. Music has been trimmed and crossfaded for this video's length. Thanks for watching — questions and corrections (with a source) are always welcome below.